The Canopy Counts Program provides a simple and fun tool for residents to help their communities track trees and tree-ready spaces across the Chicago region, while learning more about the benefits provided by those trees.
Through the program, you can learn more about the trees in your neighborhood and add information about newly planted and existing trees. This information will help The Morton Arboretum’s Chicago Region Trees Initiative, your local government, and community organizations understand how best to care for trees so they provide the most benefits for our neighborhoods.
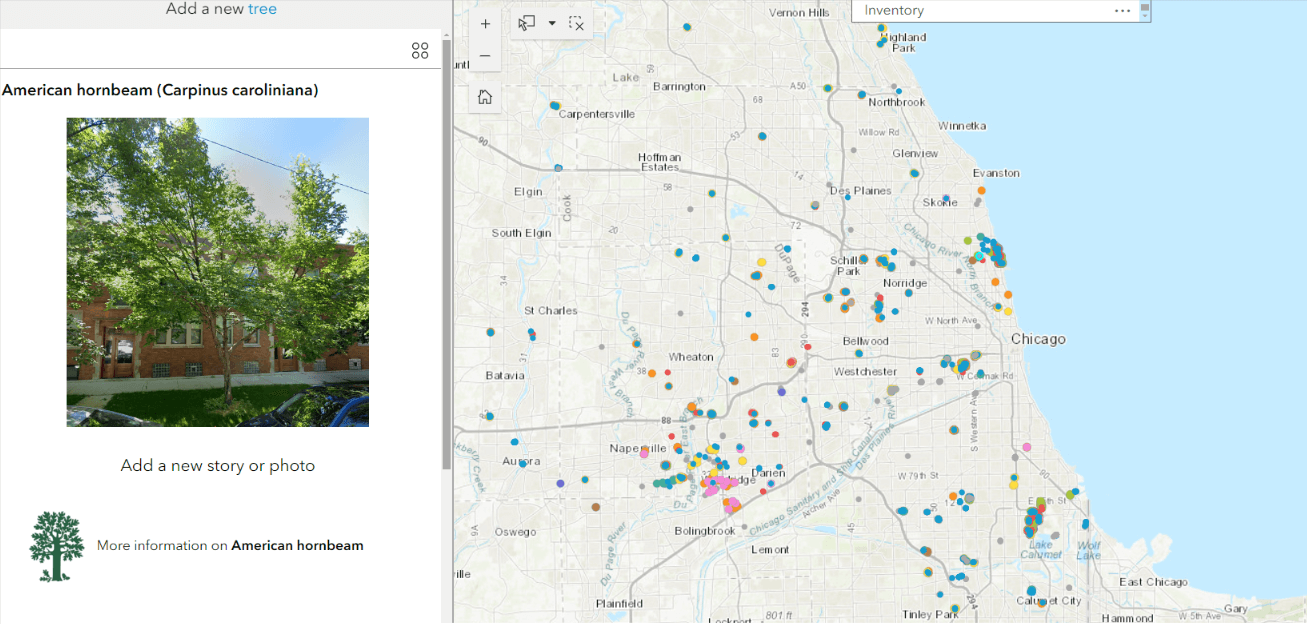
We’ve provided a simple form that will automatically insert the trees you add to the Canopy Counts map. Search the map to see what’s been added previously.
Watch the video below to see how you can use the Canopy Counts Program to record the trees in your neighborhood.
Support for the Canopy Counts Program is provided by ADM.
Add a Tree
Watch the video below to see how you can use the Canopy Counts Program to record the trees in your neighborhood.
Ready to give it a shot? Use this form to add trees to the Canopy Counts Program map.
On the form, record the species if you know it or select “unknown.” If you think you know the species, you can select the matching species then add your level of certainty about that identification. You can also add a species that isn’t on the list by typing selecting “other,” which will prompt you to fill in the blank. If you don’t know the species, select unknown.
Record on the form whether it’s a new or existing tree, whether it’s a multi-stem or single-stem tree and the tree’s trunk size as its diameter at breast height (DBH), and location. To measure the diameter at breast height, use a tape measure. If you don’t have a tape measure you can estimate the diameter at breast height (for instance, whether it’s the size of a basketball or a baseball).
You can add up to two pictures to the form, which can include the full tree, a close-up of an interesting feature, or the smiling faces of volunteers who got the tree into the ground.
Return here and use the form to add updates to recorded trees. You’ll be able to submit updates for existing trees, including adding new photos. It’s a great way to watch the progress of the trees in your yard, neighborhood, and community. Details to come seasonally.
View the Canopy Counts Map
Search the map to find trees that have already been added through the Canopy Counts Program. Each species is represented by a different color.


